Debugging Techniques in JavaScript – Complete Developer Guide
Chrome Developer Tools used for JavaScript debugging
Debugging Techniques in JavaScript: A Complete Guide for Developers
Debugging is a critical part of software development, especially in JavaScript, where code often runs asynchronously and in the browser environment. Whether you're working on a web app, a Node.js backend, or an SPA, knowing how to debug JavaScript efficiently can save hours of frustration.
If you think in other direction Programming code might contain syntax errors, or logical errors. Many of these errors are difficult to diagnose. Generally, when programming code contains errors, nothing will happen. There are no error messages, and you will get no indications where to search for errors.
If you recieved error massage or Searching for (and fixing) errors in programming code is called code debugging.
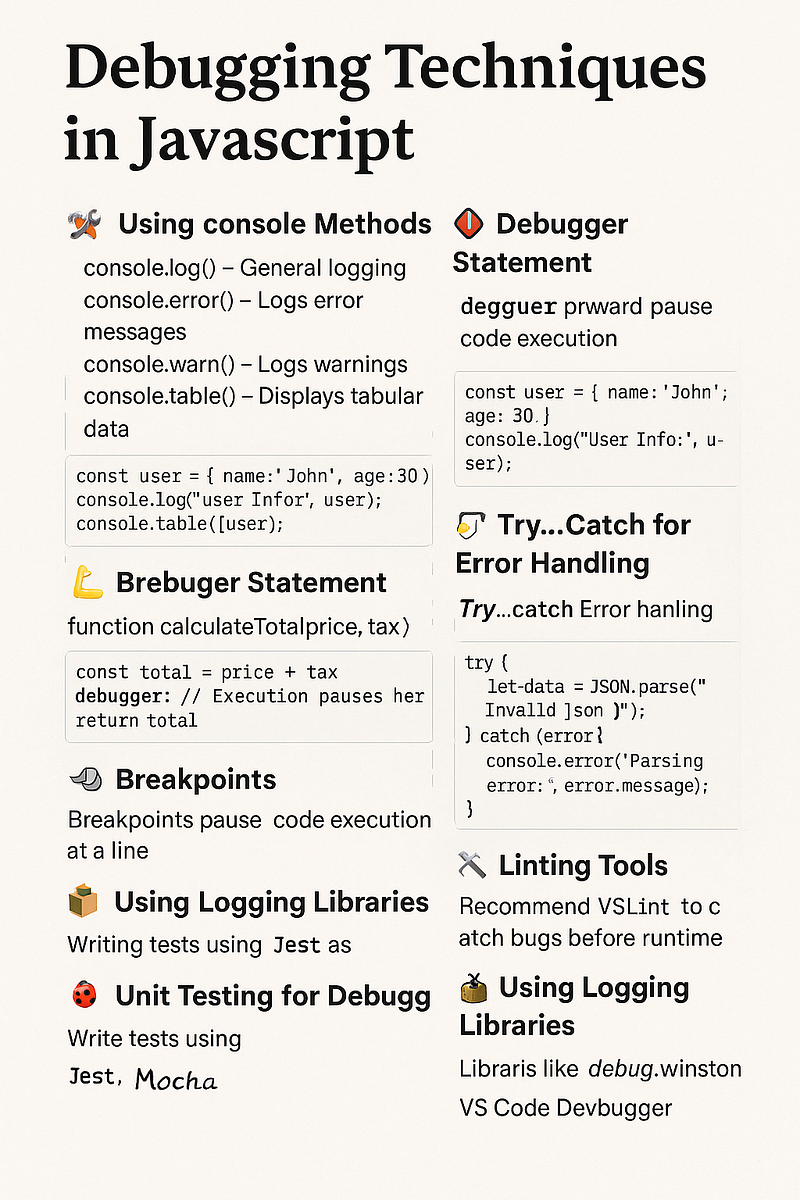
1. Use console Methods for Quick Insights
JavaScript's console object is your first tool in the debugging toolbox. It's simple yet powerful for quick checks and logs.
Common Methods:
-
console.log()– Output values -
console.error()– Log error messages -
console.warn()– Show warnings -
console.table()– Tabular display of arrays or objects -
console.dir()– Inspect object structure
const user = { name: "Alice", age: 28 };
console.log("User Data:", user);
console.table([user]);
2. Leverage the debugger Statement
Use the debugger keyword to create a hard breakpoint in your code. When the browser DevTools are open, it will pause execution at that line.
function calculate(a, b) {
  const result = a + b;
  debugger;
  return result;
}
3. Master Browser Developer Tools
Modern browsers like Chrome and Firefox offer robust DevTools for debugging:
-
Elements Tab – Inspect DOM & styles
-
Console Tab – Run commands, see logs/errors
-
Sources Tab – Set breakpoints, step through code
-
Network Tab – Analyze HTTP requests
-
Performance Tab – Identify slow operations
Use F12 or Ctrl + Shift + I to open DevTools.
4. Set Breakpoints in DevTools
Breakpoints pause JavaScript execution to let you inspect variables, view call stack, and more. You can set them by clicking on the line number in the Sources tab.
5. Use try...catch for Error Handling
Encapsulate risky code with try...catch blocks to manage runtime exceptions without breaking your app.
try {
  const jsonData = JSON.parse(response);
} catch (err) {
  console.error("JSON Parsing Failed:", err);
}
6. Inspect Watchers, Call Stack & Scope
While paused on a breakpoint:
-
Add expressions to Watch
-
Inspect the Call Stack
-
View Scope to see local/global variables
These help track down how a function was called and what data it had access to.
7. Linting for Static Code Analysis
Tools like ESLint help catch errors before runtime by analyzing your code:
-
Unused variables
-
Unreachable code
-
Syntax errors
Set up ESLint in your project to follow best practices and avoid common mistakes.
8. Use Logging Libraries
Advanced logging libraries like:
-
debug -
winston -
loglevel
These provide better control over log levels, environments, and formatting.
9. Unit Testing as a Debugging Strategy
Use unit testing frameworks such as:
-
Jest
-
Mocha
-
Jasmine
Test cases help isolate errors and ensure new code doesn’t break existing functionality.
10. Remote & Mobile Debugging
-
Chrome Remote Debugging for Android
-
Safari Web Inspector for iOS
-
VS Code Debugger for Node.js
Emulate and test your JavaScript apps on mobile and other environments.
Temporarily commenting out parts of your code can help isolate bugs by narrowing down which section causes the issue.
Conclusion
Effective debugging in JavaScript is not just about fixing errors but also understanding your code better. By mastering tools like console logs, DevTools, breakpoints, and linters, you can catch issues early and build more reliable applications.
Start applying these debugging techniques today to become a more efficient JavaScript developer!